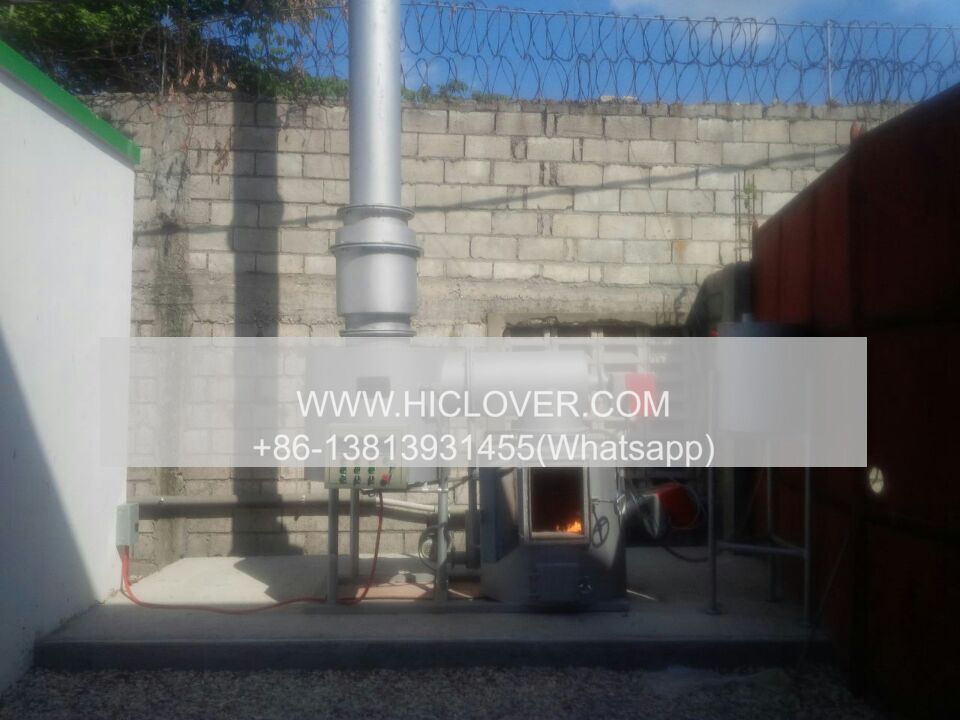
When it comes to waste management, one of the most commonly used methods is incineration. This process involves burning waste to convert it into ash, flue gas, and heat. While it can be an effective way to reduce the volume of waste and generate energy, navigating the incineration process can be complex. To help visualize and understand the various stages involved, an illustrated flow diagram can be a valuable tool.
The first step in the incineration process is the collection and transportation of waste to the incineration facility. This can include both solid and liquid waste, and it is important to separate hazardous materials from non-hazardous materials to ensure safe handling and disposal.
Once the waste has been delivered to the facility, it is typically stored in a designated area to undergo sorting and preprocessing. This may involve shredding, crushing, and screening the waste to remove any non-combustible materials such as metal, glass, and plastics. The remaining waste is then fed into the incinerator for the combustion process.
The combustion chamber is where the waste is burned at high temperatures, typically ranging from 800 to 1000 degrees Celsius. This process not only reduces the volume of waste but also generates heat energy which can be harnessed for various applications, such as electricity generation or heating.
As the waste is burned, it produces ash and gases. The ash is collected and disposed of in a designated landfill, while the gases – known as flue gas – undergo a series of treatment processes to remove pollutants and harmful emissions. This typically involves passing the flue gas through filters, scrubbers, and other air pollution control devices to ensure compliance with environmental regulations.
The treated flue gas is then released into the atmosphere, while the heat energy generated during the combustion process is either utilized on-site or exported to the grid for use by nearby communities. This is an important aspect of incineration as it promotes energy recovery and sustainability.
An illustrated flow diagram can visually represent each stage of the incineration process, making it easier for operators, engineers, and stakeholders to understand and optimize the various components involved. This can be particularly useful for identifying potential bottlenecks, improving efficiency, and ensuring compliance with environmental and safety standards.
In conclusion, navigating the incineration process requires a comprehensive understanding of the various stages involved, from waste collection and preprocessing to combustion, gas treatment, and energy recovery. An illustrated flow diagram can serve as a valuable tool for visualizing and optimizing these processes, ultimately contributing to more effective waste management and resource utilization.


